This report was done for course Tunkeutumistestaus ict4tn027-3007 organized by Tero Karvinen. The course information and assignment descriptions in finnish can be found at https://terokarvinen.com/2021/penetration-testing-course-2022-spring/.
Environments:
I used Kali Linux version 2022.1 with latest updates installed on 26.04.2022 at 21:00. The target machine was Metasploitable 2 version 2.0.0. Both machines were run in VirtualBox version 6.1.32. The tasks were done in an isolated network by using host-only networking feature of VirtualBox. I confirmed that the machines had no internet connectivity by only enabling the host-only network adapters and pinging Google’s and CloudFlare’s DNS addresses. The machines were unable to connect to the internet, but could find each other in the 192.168.56.x address space. I used Wireshark version 3.6.3 to capture the traffic. I got the Metasploitable 2 machine IP address by scanning the 192.168.x.x. address space with /16 mask.
Nmap scans and parameters
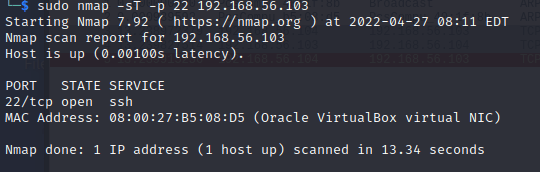
a) nmap TCP connect scan -sT
The parameter -sT initiates a connect scan that instead of using the SYN-method to connect uses higher level “connect” call. The connection is made by using Berkely Sockets API. The connect scan is the default option when SYN scan cannot be used, which is usually caused by too low privileges of Nmap. Main differences between the normal SYN scan and connect scan are in efficiency as the SYN scan uses less packets. From attacker point-of-view, another disadvantage is that the connect scan is more likely to leave entries in access logs than the SYN scan since the connection is not terminated directly after the SYN-ACK packet of the handshake. Instead the client responds with an ACK packet and only then terminates the connection with the RST packet. (https://nmap.org/book/scan-methods-connect-scan.html)
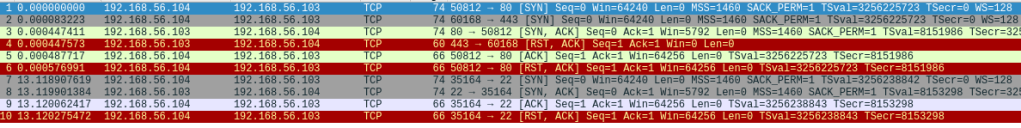
Running command “sudo -sT -p 22 192.168.56.103” generated the following traffic and output. To note here is that the program first initiated connections to both ports 80 and 443, probably as the host discovery method, reset their connections and then completed the TCP handshake with port 22. If the server accepted the connection request, the TCP handshake was comlpeted in every connection before termination as expected.

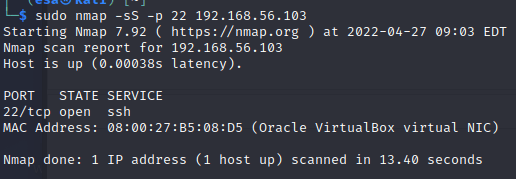
b) nmap TCP SYN “used to be stealth” scan, -sS
The default option for scanning when sufficient privileges are presented (requires root or administrator). This scan option is efficient and relatively unobtrusive as it does not finish the TCP handshake but terminates the connection after the SYN-ACK packet. (https://nmap.org/book/synscan.html)
The output and traffic generated by command “sudo nmap -sS -p 22 192.168.56.103”. The “-sS” parameter is optional as the command was run as root. The same result could have been achieved without the parameter. From the traffic can be seen that the TCP handshake was never finished. The output included information about the state of the port and the service that was running on the port.

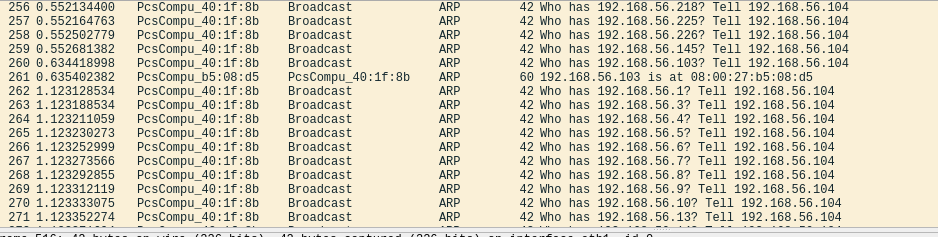
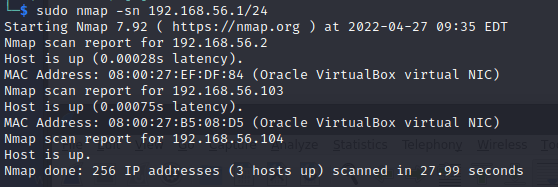
c) nmap ping sweep -sn
The “-sn” parameter disables the port scan and lists the hosts that were found. Also known as the “ping scan”. The parameter sets Nmap to only do host discovery and print out the found hosts. This scan is useful for light reconnaissance on the target network to discover hosts while staying fairly hidden. (https://nmap.org/book/host-discovery-controls.html#host-discovery-sn)
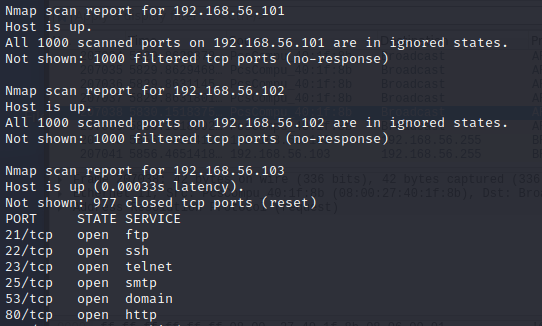
The traffic generated by the scan in a local network included ARP queries to all the possible hosts, nothing else. The output of the scan was a list of hosts that responded to the query in the network. In the example below, I used a /24 mask to scan the whole address space assigned for the host-only networking. The found hosts were my DHCP server, the Kali machine I was using and the Metasploitable 2 machine.
d) nmap don’t ping -Pn
Parameter “-Pn” disables host discovery phase of the scan and continues directly to scan all the given addresses. Usually Nmap performs the host discovery and then does heavier scanning only on the hosts that are known to be up, but with “-Pn” parameter all the hosts are treated as online. This method generates quite a lot of network traffic, but can also save few packets if the host is known to be online. Treating all of the hosts as online can provide the user with more data about the target, but takes significantly longer to perform. (https://nmap.org/book/host-discovery-controls.html)
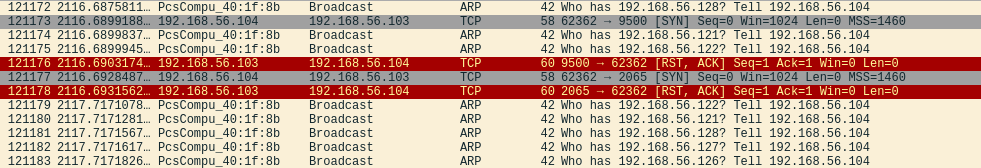
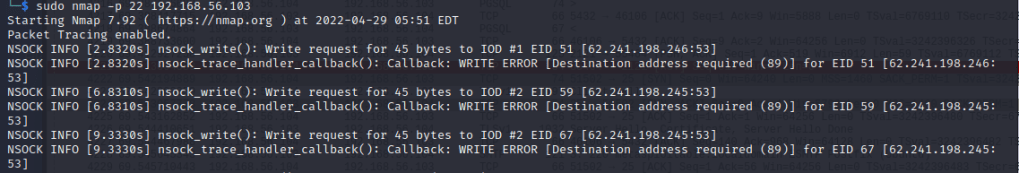
During the testing and demonstration of the scan mode I ran into a problem: the ARP query was performed in the local network despite the set parameters, which set the available IP addresses anyways. So running Nmap with and without the “-Pn” parameter resulted exactly in the same number of packets sent and received. To overcome the limitation I had to use the “–disable-arp-ping” parameter (https://nmap.org/book/man-host-discovery.html section “-Pn”). With this parameter, the traffic generated multiplied exponentially. I was left with a question after analyzing the traffic: why does the SYN scan generate so much traffic over ARP protocol during the scan? Is this related to the fact that the test was done in a local network and the routing uses ARP protocol? And since there is no reply from the target port, the TCP connection is never established and only the ARP traffic is shown? For open ports the scan performed half of the TCP handshake as expected (see image below). The initial host discovery was skipped, but the traffic dump ended up having multiple tens of thousands of packets using the ARP protocol during the scan.
A little performance comparison: scan of the 192.168.56.x/24 address space with no additional parameters required around 4500 packets to complete and took 28 seconds. With added “-Pn” and “–disable-arp-ping” parameters, the packet count was at 207000 and the scan had only gone through 128 hosts in 1.5 hours. In total the scan would have taken anywhere between 3 and 3.5 hours if I would not have interrupted it.
The output of the scan differed slightly from the normal interactive output. The hosts were listed in the output one by one, no matter if there were open ports or not. The standard scan skips the hosts that are offline and only shows the scan results of the online hosts.
e) nmap version detection -sV (example of one service in one port is enough)
The service version detection probes the open ports and tries to determine information about the services and their versions. Nmap has a large database called “nmap-service-probes” containing different probes that it uses to match expressions and parse responses. One of the main benefits of this scan is to retrieve detailed information about softwares, such as their versions, hostname etc. (https://nmap.org/book/man-version-detection.html)
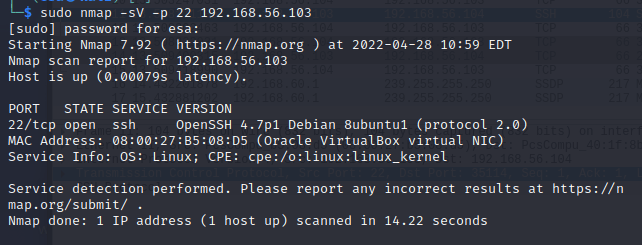
To demonstrate the scan, I ran command “sudo nmap -sV -p 22 192.168.56.103”. The traffic snippet begins with the half-TCP handshake to verify that the host is up (packets 4-6), also known as the SYN scan for host discovery. In the next step (packets 8-10) the TCP handshake is completed so that data can be transmitted. The server sends its Protocol Version Exchange information in packet 11 with SSH protocol, to which the client responds with an ACK packet. Nmap compared the response to its “nmap-service-probes” database to recognize patterns. SSH was recognized and all the required information was received. Since there was no need for more communication or probes, the client terminated the connection with the FIN ACK packet and the server responded with another FIN ACK packet. The last ACK packet (15) was just a confirmation that the client received the server’s FIN ACK packet. Source and more details: https://datatracker.ietf.org/doc/html/rfc4253#section-4.2.

The output was similar to the default scan’s output, but with additional information.
f) nmap choose ports -p1-100, –top-ports 5, -p-
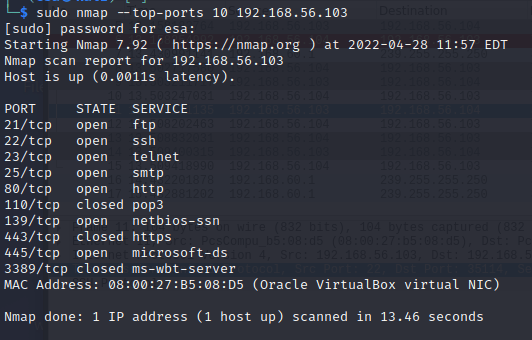
The parameter -p- sets the port scan range to all ports (1-65535) and “-p 1-100” scans ports between 1 and 100. (https://nmap.org/book/man-port-specification.html) The “–top-ports <integer value>” parameter uses a file called “nmap-services” to scan the most commonly found open ports. (https://nmap.org/book/nmap-services.html) The value given determines how many of the common ports are scanned. In this case, 5 will cause the five most common ports to be scanned according to the document, 10 will scan 10 most common ports etc. I demonstrated the usage of “–top-ports” parameter as it was a new parameter for me to learn. The output seemed to be the same as with the default scan.
g) nmap choose ip-addresses; list, netmask 10.10.10.0/24, start and stop address 10.10.10.100-130 (ipcalc helps in understanding how to use the netmask)
Nmap has multiple ways to set IP address ranges. The most basic one is to set the target in the command without parameters. The command can take multiple addresses or address ranges. For example, inserting comma-limited value nmap 10.10.10.100-130 will scan the address space from 10.10.10.100 to 10.10.10.130.
If one wants to use netmask, it is also possible. Appending /<mask size> will set the address space to scan. For example, using /24 mask on 10.10.10.0 will scan the space 10.10.10.0-10.10.10.255.
IP-addresses can also be inserted as a list from a file. This becomes convenient in some situation when the number of hosts to scan increases. Parameter “-iL <file>” initiates the list function. There are certain requirements for the file format: “Entries can be in any of the formats accepted by Nmap on the command line (IP address, hostname, CIDR, IPv6, or octet ranges). Each entry must be separated by one or more spaces, tabs, or newlines” (https://nmap.org/book/man-target-specification.html).
I was familiar with the netmask, comma-limited value and entering multiple hosts already, so I tried the file method. First I created a file “host.scan” which only content was the IP address of the Metasploitable 2 virtual machine. Then I ran command “sudo nmap -iL host.scan -p 22” to scan port 22 of the machine. The scan ran successfully, the output and the generated traffic were same as with the default scan.
h) nmap output files -oA foo. What is every file format suitable for?
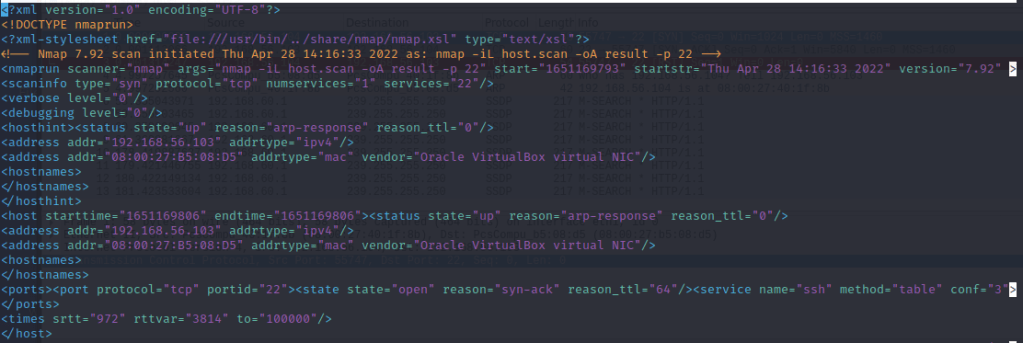
Parameter “-oA” saves the output in three different formats at once. The output is saves as XML, greppable (.gnmap) and normal (.nmap) formats. The normal format is different from the output seen in the terminal. Taking the given example “nmap -oA foo” command, the files are saved under name “foo”. (https://nmap.org/book/man-output.html)
I ran the same command as in previous task, this time with added “-oA result” parameter. The terminal output and the traffic were the same as in previous task. I opened each of the files with nano to see how they look.
Comparing to the terminal output, the saved XML included more detailed information such as start time of the scan, end time, reason why the port could be determined to be open etc. This information could possibly be seen in the terminal output too with increased verbosity level? I believe this format is useful for programmers, since the xml can be processed with APIs and is easy to integrate to software. (https://nmap.org/book/output-formats-xml-output.html)
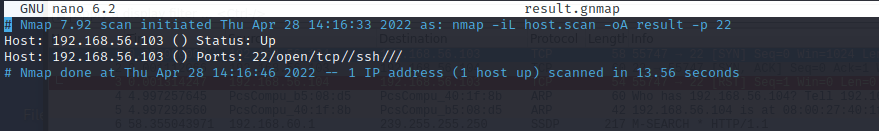
The greppable output (.gnmap) was quite different. It offered little information but can be grepped quickly to find data. I believe this is useful when working with large number of hosts, as it is possible to quickly grep all the lines containing “ports: 22” and “ssh” for example. (https://nmap.org/book/output-formats-grepable-output.html)
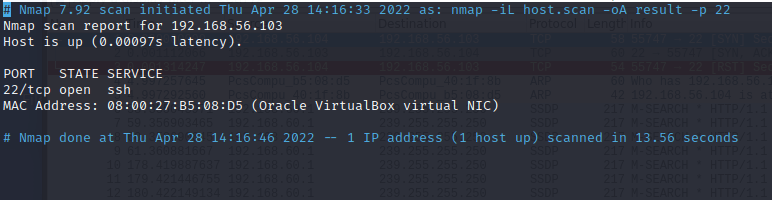
The last type is the normal output. As said before, it slightly differs from the interactive output that is printed in the terminal. Some of the information was removed, such as the boilerplate at the beginning. The normal output has been designed in a way that it is easy to read and analyze later. (https://nmap.org/book/output-formats-normal-output.html)
i) nmap version scanning -sV
Same as task e?
j) nmap OS fingerprinting, version detection, scripts, traceroute, -A
The “-A” parameter initiates multiple parameters at the same time. It is a lot easier and error-proof to just type one parameter instead of writing the whole “-O -sV -sC –traceroute” string. The result of the scan is quite extensible and provides a good starting point for additional scans and analysis. My source was the help page of the Nmap tool for this task.
The output is very long and has tons of information, even too much to be put here. So instead it can be found behind this link: https://esakontio.com/penetration-testing-ict4tn027-3007/h4-tiedustelua/nmap-a-scan-text-dump/. The file format is the interactive output copied from the terminal. Comparing to other scans, the level of details of the information is high because of the combined scans.
k) nmap runtime features (man nmap: runtime interaction): verbosity v/V, help ?, packet tracing p/P, status s (and many others)
Pressing key v during the runtime increases the verbosity level, shift+v decreases it. Same idea works with debugging information which can be toggled by pressing d. Debugging and verbosity have 10 different levels ranging from 0 to 9. P in uppercase turns packet tracing off, lowercase turns it on. Status message can be displayed by pressing nearly any other key, most logical being “s” for status. (https://nmap.org/book/man-runtime-interaction.html)
All the tests were run with command “sudo nmap -p 22 192.168.56.103” with specific options turned on during runtime.
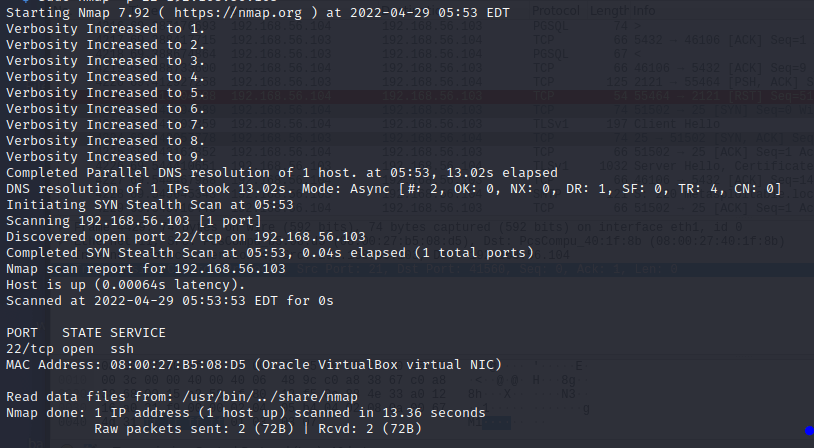
Verbosity 0 vs 9: Level 0 displayed no information about the scan, only the list of found hosts and ports at the end. Verbosity 9 offered more information during the runtime. DNS resolution, scan type and port information were displayed. The “read data…” section at the end is a bit unknown to me. High verbosity levels make the output hard to read and are intended for machine processing. Highest suggested verbosity level for humans is 2. (https://nmap.org/book/output-formats-commandline-flags.html)
Turning on packet tracing displayed a complete list of packets that were sent and received on top of all the regular information. Normally the packet tracing is turned off and not visible.
Debugging information presented another level of detail when increasing the verbosity is not enough. When turned to maximum level, the output for one host is somewhere in the range of tens of thousands of lines of output. Scanning one port in this case produced 233 lines and can be found here: https://esakontio.com/penetration-testing-ict4tn027-3007/h4-tiedustelua/nmap-d9-scan-one-port-interactive-output-dump/. The output is very heavy to read, best suitable for solving a very specific problem or machine analysis.
l) ‘sudo nmap’. How nmap works with and without sudo? Execute and analyze an example
The difference between using Nmap with and without sudo is the connection method. With administrator right Nmap uses raw packets, but when insufficient rights are presented the program uses system level call “connect” from the Berkely Sockets API to scan the target. (https://nmap.org/book/scan-methods-connect-scan.html)
With sudo rights, the scan first did the host discovery over ARP protocol in the local network. Then the TCP SYN scan was done, which performs only half of the handshake before resetting the connection.

When sudo rights are not presented, the scan uses the “connect” system call for the connection to be established and the handshake must be completed before resetting. Since the TCP handshake was finished, resetting the connection required one more packet. The packet count doubled in comparison to the test with sudo rights, which was mostly caused by different host discovery method. Since Nmap did not have sufficient rights to generate raw packets, it had to use HTTP and HTTPS connect methods in host discovery.
m) nmap, compare -sV vs -A duration (and the amount of sent data if you can; time, nethogs, wireshark). Use Metasploitable2 as target.
I used command “sudo nmap -sV 192.168.56.103” and “sudo nmap -A 192.168.56.103” for the tests. The reason I chose to scan the whole host instead of just singular port is that it gives better data to compare the amount of traffic generated and the time the scan took. The tests were ran with sudo rights because I feel it is fairly unrealistic to perform this kind of scan without administrator rights.
When testing with “-A” parameter, the traffic capture recorded around 4300 packets and the scan took 66.95 seconds. With “-sV” parameter, Wireshark recorded roughly 2500 packets and the scan took 24.97 seconds. Running only the version scan can be more efficient in cases where the service information is enough. It also generates less traffic, possibly reducing the risk of detection.
Service and version scan:


Scan with “-A” parameter:


d) Like the ninjas. Does nmap scan disguise itself well from the server? Tips: Install Apache. Run nmap -sV on your local server. Find the related entries from the Apache log. In Wireshark “http” is a handy filter. “p” activates packet tracing during runtime. Voluntary extra: does nmap version scanning leave evidence in the Apache logs?
I created a new Ubuntu virtual machine, applied the latest updates and installed Apache web server on the machine. Next I allowed HTTP traffic on port 80 through the firewall, closed the machine and switched the network adapter from the Internet adapter to the host-only virtual network adapter. This way my Kali machine could find the Ubuntu on the same network. Just to be sure, I tried updating the repos and pinging Google DNS address after bootign the Ubuntu. All of the tests failed with network resolving errors.
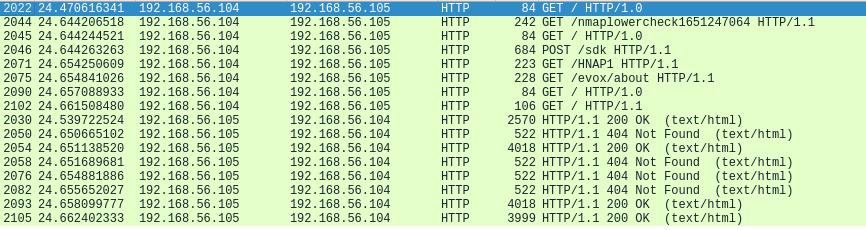
I scanned the network 192.168.56.x/24 to get the IP address of the the Ubuntu machine. Next I removed all the entries from the apache logs at /var/log/apache2 in the Ubuntu machine. Then I ran the service and version detection scan on the address while capturing the traffic with Wireshark. Command I used was “sudo nmap -sV 192.168.56.105”.
In the traffic capture below the packets are filtered with “http” and are sorted by source. As can be seen, Nmap sends seven different GET requests and one POST request to the server. Each one of the packets are different probes from the “nmap-service-probes” database and return information to the client with the server’s responds.
Next the log analysis. One look into the Apache logs of the Ubuntu machine makes it clear that this scan does not hide itself well from the server. One could easily grep the log and find rows that have “nmap” in them. It is blatantly easy to find these entries, at least with the latest Apache version. I am not sure if the Apache software version has any effect on the log entry content.

e) What are the most common and interesting services that UDP scan could find? (No need to perform a test, just the answer and references are enough)
The most common services using UDP are DNS, SNMP and DHCP. (https://nmap.org/book/scan-methods-udp-scan.html)
DNS services can provide possibilities for exploitation. For example ISC BIND is a DNS software known for having multiple incidents in the past. (https://kb.isc.org/docs/aa-00913)
“Simple Network Management Protocol (SNMP) is a widely used protocol for monitoring the health and welfare of network equipment (eg. routers), computer equipment and even devices like UPSs. Net-SNMP is a suite of applications used to implement SNMP v1, SNMP v2c and SNMP v3 using both IPv4 and IPv6.” (http://www.net-snmp.org/) Just searching CVE database for SNMP tells why this might be interesting find for anyone. 439 hits were found from the official MITRE CVE database. (https://cve.mitre.org/cgi-bin/cvekey.cgi?keyword=snmp)
DHCP is Dynamic Host Configure Protocol, intended to automatically give a device an IP address when they join the network. Used very widely in both enterprise and home networks. (https://docs.microsoft.com/en-us/windows-server/networking/technologies/dhcp/dhcp-top) DHCP can be used to perform some attacks, for example https://www.mcafee.com/blogs/other-blogs/mcafee-labs/dhcp-client-remote-code-execution-vulnerability-demystified/.
f) Why UDP scanning is difficult and unreliable? Why you should use –reason flag with UDP scans? (No need to perform a test, just the answer and references are enough)
Scanning UDP is difficult because UDP is a stateless protocol, so scanners cannot differentiate between a server and client port. UDP ports do not often respond anything to the probes so determining whether a port is open or not is difficult. “ICMP port unreachable error (type 3, code 3)” (https://nmap.org/book/scan-methods-udp-scan.html) is the only error that can reliably tell that a port is closed. Getting a response, which is rare to happen, can only tell if a port is open. Any other result leads to the port being either open or filtered. (https://nmap.org/book/scan-methods-udp-scan.html)
The “–reason” flag should be included because it tells why the port was determined to be in a state that the program thinks it is. (nmap manual page)
h) ffuf (trying directory scan is enough, everything else is a bonus)
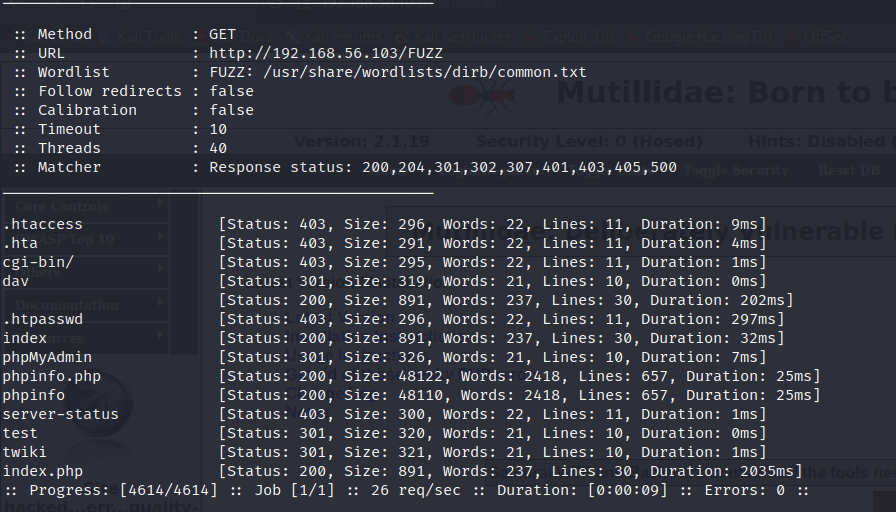
Ffuf is a tool that can be used for content discovery. The program is capable of using multiple methods, but this task focuses on the most basic one. Reading through the manual page was required to learn how to use the program. Flag -D activates the DirSearch directory wordlist compatibility mode, -u <url> sets the url and -w <wordlist> takes in the wordlist file. It is important to note that the word “FUZZ” must be always present in the command, usuallt it is integrated to the URL. Command “ffuf -u http://192.168.56.103/FUZZ -D -w /usr/share/wordlists/dirb/common.txt” generated this output. The scanned machine was the Metasploitable 2.
i) nikto
Nikto is a vulnerability scanner that is designed to test web servers for a large quantity of vulnerabilities, “including over 6700 potentially dangerous files/programs, checks for outdated versions of over 1250 servers, and version specific problems on over 270 servers. It also checks for server configuration items such as the presence of multiple index files, HTTP server options, and will attempt to identify installed web servers and software. Scan items and plugins are frequently updated and can be automatically updated.” (https://cirt.net/Nikto2) Nikto is not designed to be stealthy and leaves very obvious marks in the logs.
Running Nikto is easy. The only required parameter is the url of the target after flag “-url”. Command I used was “sudo nikto -url 192.168.56.103”. I ran the most basic version of Nikto scan. The program has plenty of options for debugging, detection evasion, scan options etc.
The output for Metasploitable generated was quite long. To keep this article more readable, it can be found here: https://esakontio.com/penetration-testing-ict4tn027-3007/h4-tiedustelua/nikto-scan-metasploitable-2/. Nikto did exactly what it was supposed to do. The scan found possibly vulnerable files and misconfigurations that could be used to benefit the adversary. Nikto ran quite fast, as the scan only took 119 seconds to complete. I was expecting a significantly longer scan. The result seems reasonable as majority of the marked items are points-of-interest for the attacker. False positives are possible and common with vulnerability scanners.
j) Pizza fantasia: Choose and demonstrate one reconnaissance tool, for example EyeWitness, wpscan, openvas or similar.
Wpscan is a tool dedicated to scanning and analyzing WordPress sites for vulnerabilities. It includes multiple features, one of them being username enumeration and brute-forcing passwords. (https://wpscan.com/wordpress-security-scanner)
I actually had to set up WordPress first to try the tool. I installed WordPress on the Ubuntu machine I created earlier in this assignment by following the instructions at https://ubuntu.com/tutorials/install-and-configure-wordpress#2-install-dependencies. The instructions provided an easy and efficient way to get WordPress running in less than 15 minutes.
First I tested that the WordPress service can be found and accessed from my Kali machine. I was able to locate it with a scan in Nmap.
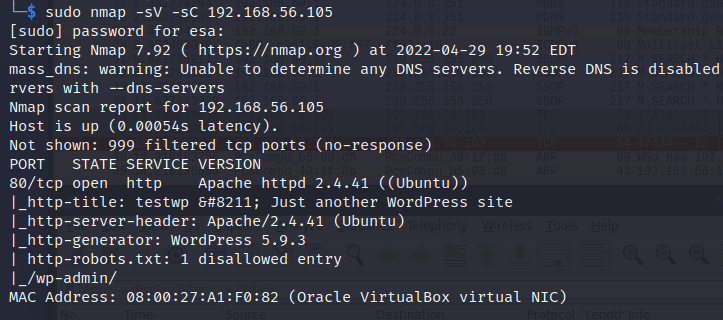
Next was time for the Wpscan tool. Usage is simple, the most basic vulnerability scan is launched with only one parameter “-url <target_url>”. The output is again quite long and found here: https://esakontio.com/penetration-testing-ict4tn027-3007/h4-tiedustelua/wpscan-scan-result/.
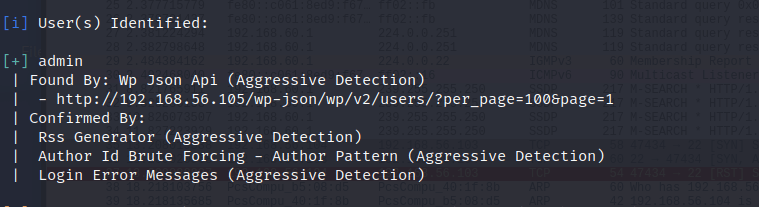
The results offered information about possible vulnerabilities the site has, ranging from configuration mistakes to outdated and dangerous plugins. I wanted to take things a step further and test the enumeration and brute forcing. First I had to enumerate the usernames. Enumeration is activated with parameter “-e” and it can be used for enumerating different types. User enumeration is achieved with option “u<id-range>”. More information can be found in the tool’s help page. The command I used to enumerate users was “wpscan -url 192.168.56.105 -e u1-10”, which enumerates user ids between 1 and 10. The result was positive, one username was found: admin.
Next I moved to the brute-forcing. I had a file existing called “admin_passes” which includes all the passwords from rockyou.txt that include the word “admin” in them. I ran the brute force with this password list. The command I used was “wpscan –url 192.168.56.105 -P admin_passes -U admin”. “-P” parameter takes in the password, or list of passwords, as argument. Parameter “-U” takes in the username or list of usernames. The command finished in 13 seconds and a hit was found!
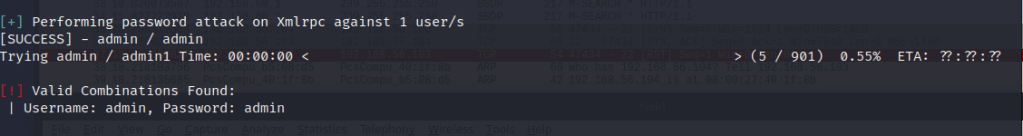
The admin had used very poor practises on his password and username, shame on them. Only 5 tries were requested to break the password. The admin account was now compromised and could be used to steal data or create trouble.
z) Read the articles and watch the videos, make notes (few bullet points per article/video are enough. No need to perform any tests.
- € Santos et al: The Art of Hacking (Video Collection): [..] 4.3 Surveying Essential Tools for Active Reconnaissance. Includes port scanning. 5 videos, total 20 min.
- The reconnaissance is directly to the target network.
- Can be seen in the logs (usually).
- Having methodology and routine is key to success.
- Nmap is the most used and versatile scanner, Masscan is the fastest for large batches.
- Lyon 2009: Nmap Network Scanning: Chapter 1. Getting Started with Nmap
- The vulnerability scanning begins with network discovery (-sL scan).
- Felix found quite a lot of holes in the client network.
- The stories were interesting, nice intro to nmap.
- Take a look (no need to read through, 40 pages long): Lyon 2009: Nmap Network Scanning: Chapter 15. Nmap Reference Guide
- The best source of information after the man page.
- Offers basically all the knowledge one can need.
- Port Scanning Basics (learn: open, closed, filtered; everything else quick read-through)
- Open = what hackers and pen testers want to see.
- Closed = port is accessible but no respond, meaning there is no service running on it.
- Filtered = Due to reasons Nmap is unable to determine whether the port is open or not. Most often caused by firewalls or router rules. In UDP, some ICMP error codes also mark the port as filtered.
- Port Scanning Techniques (learn: -sS -sT -sU; otherwise just quick read-through)
- -sS = The default scan nmap does when the privileges are high enough. Uses half-completed TCP handshake to test the port.
- -sT = Connection scan. Uses a system-level connect scan for testing. Not as efficient as TCP SYN scan.
- -sU = UDP scan, used to specifically scan ports for UDP services.
- Reading through the whole chapter will tell everything (at least almost) what one needs to know about port scans with Nmap.
- Take a quick look (no need to read completely through): man nmap
- Great for researching information about commands, parameters and functionality without leaving the terminal.
